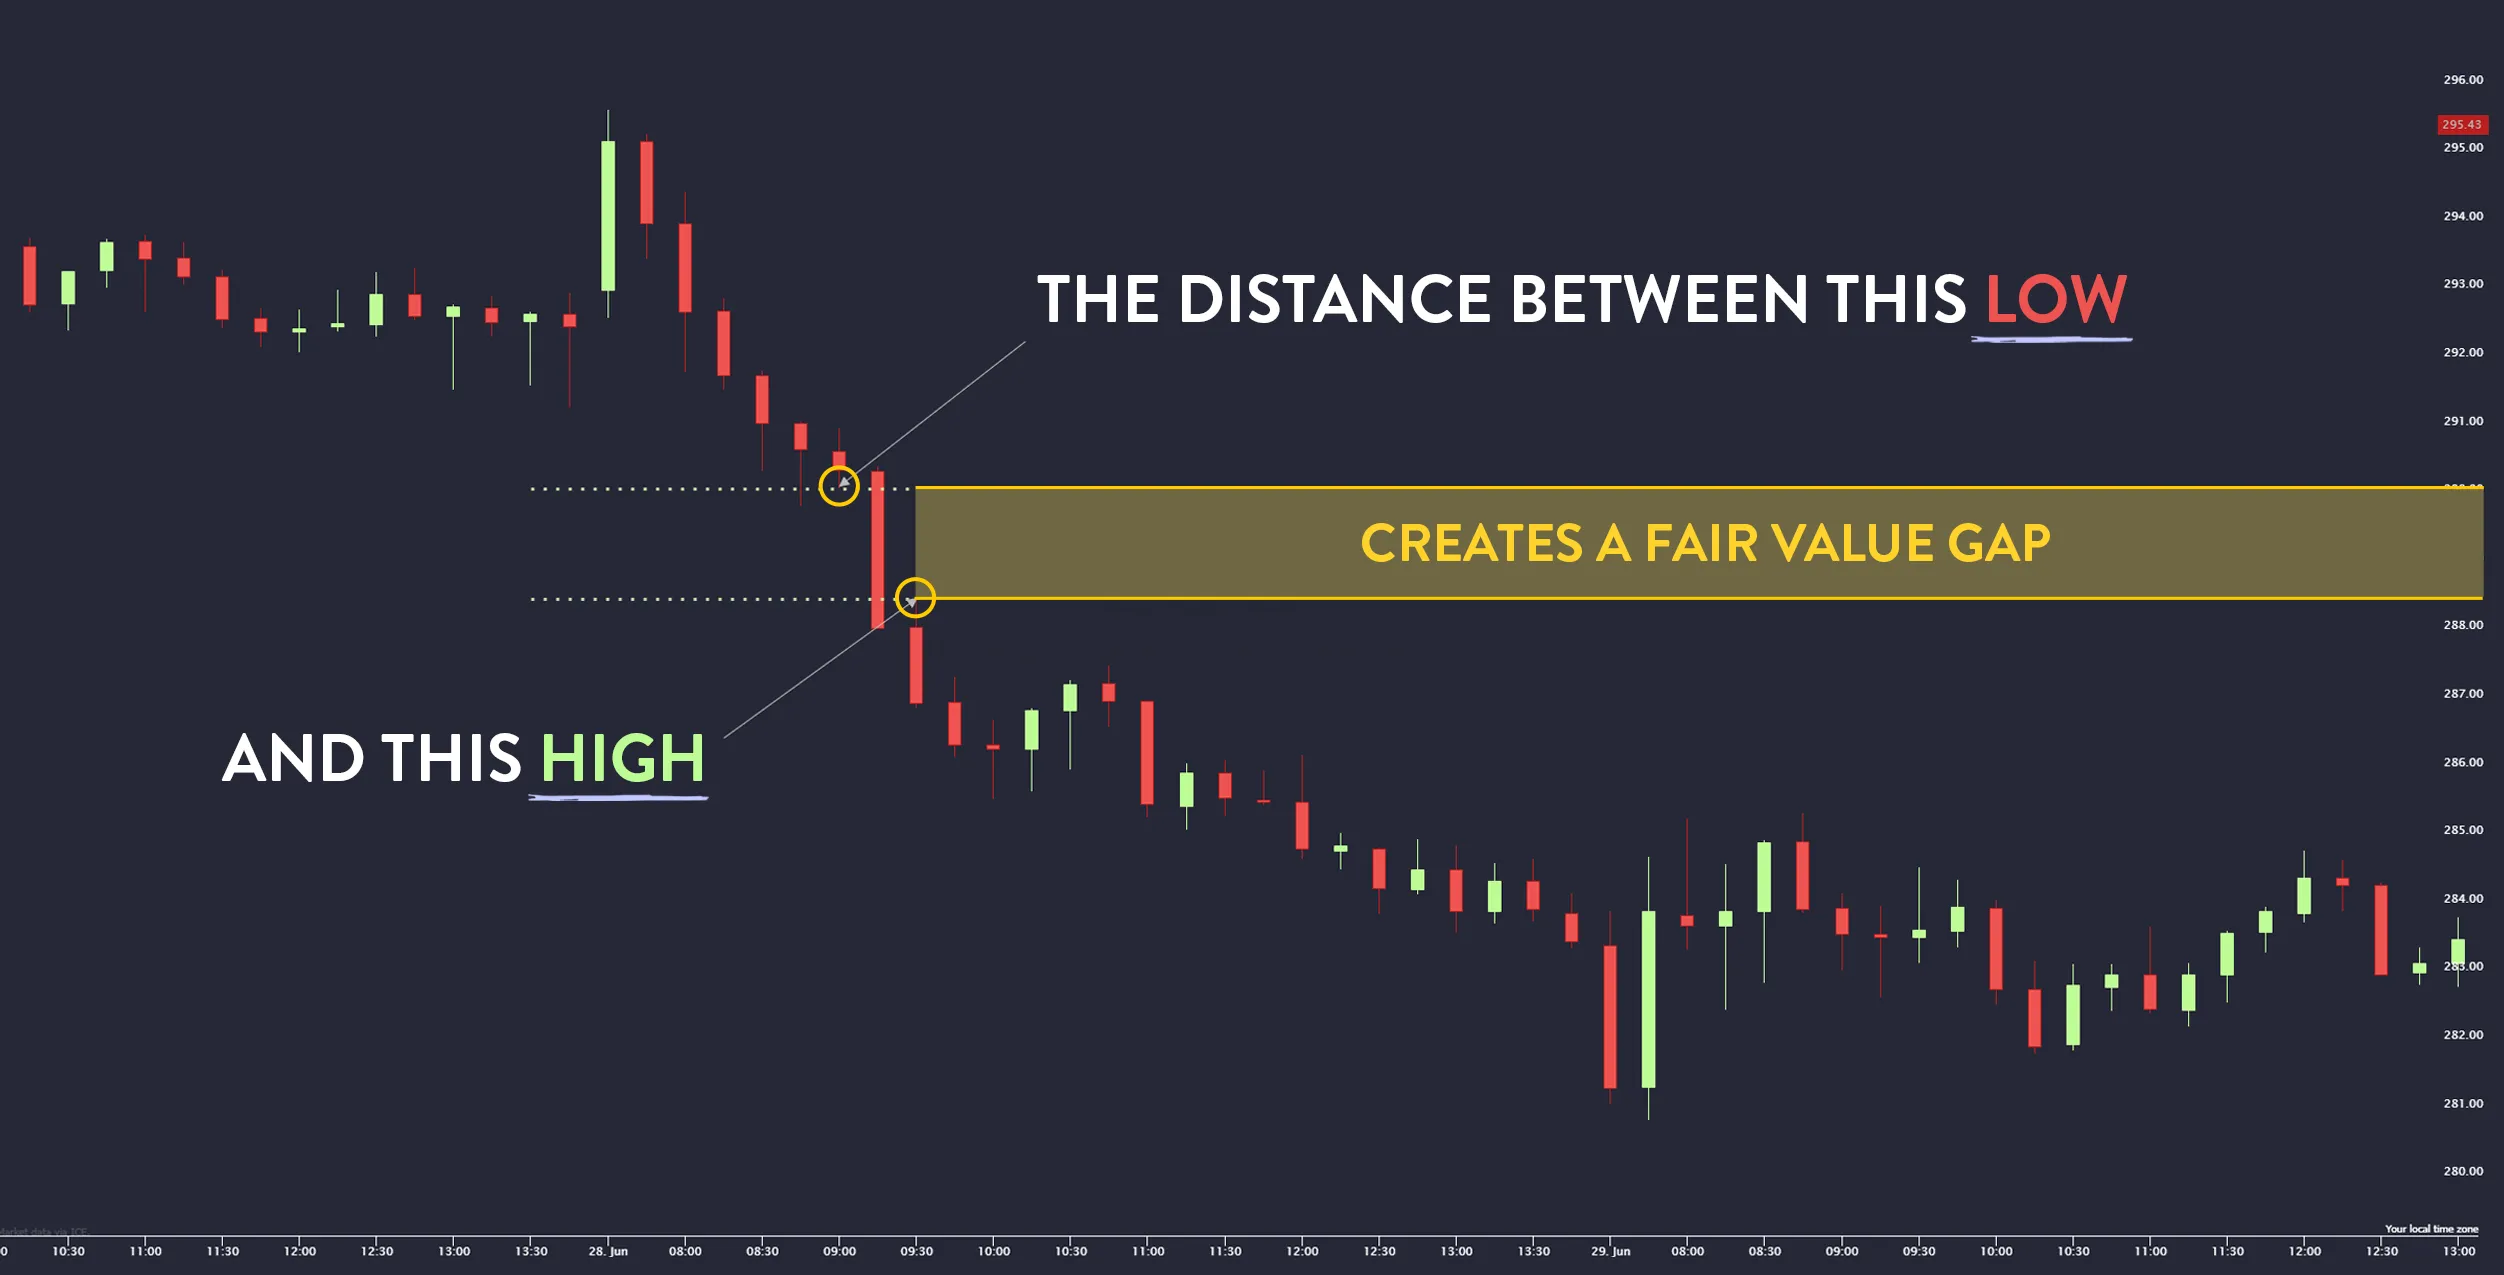
In trading prices do not always move smoothly. There are times when price jumps from one level to another without trading much in between. This sudden movement leaves a gap on the chart. A fair value gap is one of these market patterns and is often used by traders to understand possible future price moves.
A fair value gap is an area on a price chart where buying or selling pressure has been so strong that price moved too fast and leaving a section with very few or no trades. This area can act as a magnet later because markets tend to revisit levels where little trading took place. Traders look for these gaps to find areas where price may return before continuing in the original direction.
How a fair value gap forms
A fair value gap forms when there is an imbalance between buyers and sellers. For example if a large order enters the market and pushes price higher in a short time then there may be little trading between the starting point of that move and the new price level. The same happens in the opposite direction when strong selling pressure forces price down quickly.
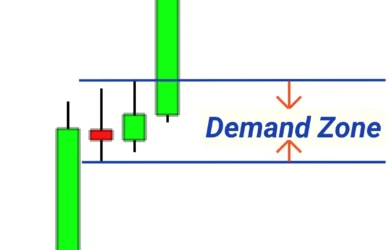
In a candlestick chart a fair value gap often shows as a three-candle pattern.
- The first candle moves strongly in one direction.
- The second candle also moves in that same direction and leaving a space between the first and third candles where no price overlap happened.
- The third candle does not close the gap immediately.
This space is the fair value gap. Traders mark it as an important area on their charts.
Why fair value gaps matter
The reason traders care about fair value gaps is because price normally returns to these areas. This return is called “filling the gap”. It happens because market participants who missed the original move may want to enter when price comes back. Also those who entered late may want to exit near the gap which is creating more trading activity there.
A fair value gap is not just a visual gap. It represents an imbalance. In a balanced market and buyers and sellers agree on price. In an imbalanced market one side is stronger but over time balance often returns. This return process can cause price to revisit the fair value gap.
Using fair value gaps in trading
Traders use fair value gaps as part of their decision-making process. A common approach is mentioned below which may help you understand it better.
- Identify a fair value gap on the chart
- Wait for price to return to the gap
- Look for confirmation that the original trend will continue after the gap is filled
- Enter the trade in the direction of the original move
For example in an uptrend if price moves quickly higher leaving a gap and a trader may wait for price to fall back into that gap. If buying pressure appears again inside the gap then they may enter a buy position expecting price to rise again.
Fair value gap vs. other gaps
There are different types of gaps in trading and not every gap is a fair value gap. A fair value gap is unique because it is linked to the concept of price imbalance and not just a simple opening difference. It is based on the idea that markets seek efficiency and balance. When they become inefficient then they can return to correct that.
- Opening gaps happen when the market opens at a different price than the previous close.
- Breakaway gaps happen when price breaks out of a range.
- Runaway gaps appear during a strong trend and signal continuation.
- Exhaustion gaps show near the end of a trend.
Fair value gaps in different markets
Fair value gaps are not limited to stocks only but they can be found in forex, commodities, indices and even cryptocurrencies. Market where price moves in candlesticks or bars can show fair value gaps. In fast-moving markets like forex or crypto the gaps can form within seconds during news releases or high-volume periods but in slower markets like some commodities the gaps may form over hours or days. The principle is the same which is a gap signals imbalance and potential for a future revisit.
Timeframes and fair value gaps
A fair value gap on a daily chart may represent a major imbalance and can take weeks to fill. On a 5-minute chart it may fill within minutes. Traders choose the timeframe based on their style. The key is to understand that not all gaps will be filled quickly. Some may remain open for a long time and some may never be filled at all.
- Scalpers focus on small timeframes and quick gap fills.
- Swing traders look for gaps on higher timeframes and wait for larger moves.
- Position traders may track major gaps as part of long-term analysis.
Limitations of fair value gaps
While fair value gaps can be useful but they are not a guarantee of future price action and sometimes price will move away from a gap and never return. This can happen when the market continues in a strong trend without looking back. Also identifying gaps can be subjective. Two traders may draw different boundaries for the same gap depending on how they interpret the candlestick wicks and bodies. Using fair value gaps without other tools can lead to poor decisions. Most experienced traders combine them with other analysis methods like support and resistance, moving averages or volume analysis.
Examples of how traders use them
- In an uptrend a trader spots a gap formed after a news event. Price later returns to the gap and strong buying candles appear inside it. The trader enters a buy trade aiming for the previous high.
- In a downtrend the price drops sharply which then creates a gap. It later pulls back into the gap but selling pressure appears again. The trader sells by expecting the trend to continue.
- In range-bound markets: Fair value gaps are less common but can signal breakout areas.
Risk management when trading fair value gaps
If a setup looks perfect then the risk control is important. Traders normally place stop-loss orders just beyond the gap to protect against unexpected moves. Position sizing should also match the trader’s account size and risk tolerance. Since gap fills are not guaranteed and traders may set a maximum number of attempts for trading the same gap. If price does not react as expected then they move on to other opportunities.
Combining fair value gaps with other strategies
Few traders pair fair value gaps with Fibonacci retracement levels to find stronger confluence. For example if a gap lines up with the 50% retracement of a prior move and it may attract more interest. Others look for volume spikes near the gap to confirm that the market is reacting. In algorithmic trading the fair value gaps can be programmed into a bot that scans charts for them. The bot then alerts the trader or takes trades based on predefined rules.
Psychology behind fair value gaps
At the core of this concept is trader behavior. When price moves quickly then the emotions run high. Traders who missed out feel regret and want another chance to enter. Those who got in late feel fear and want to exit at break-even. These actions create the push and pull that brings price back to the gap. Understanding this psychology can help traders see why gaps often act as magnets for price. What is a fair value gap? it is not just a technical pattern but also a reflection of human behavior in markets.
FAQs
1. What is a fair value gap in simple terms?
It is an empty space on a price chart created when price moves so quickly that there is little or no trading in that range. Markets often return to this area later.
2. How do traders use fair value gaps?
They mark the gap and watch for price to return to it. If the original trend shows signs of continuing from that level, they may enter a trade in that direction.
3. Do all fair value gaps get filled?
No. While many do, some remain open for a long time or never get filled, especially in strong trending markets.
4. Which markets show fair value gaps?
They can appear in any market with price charts, including stocks, forex, commodities, indices, and cryptocurrencies.


