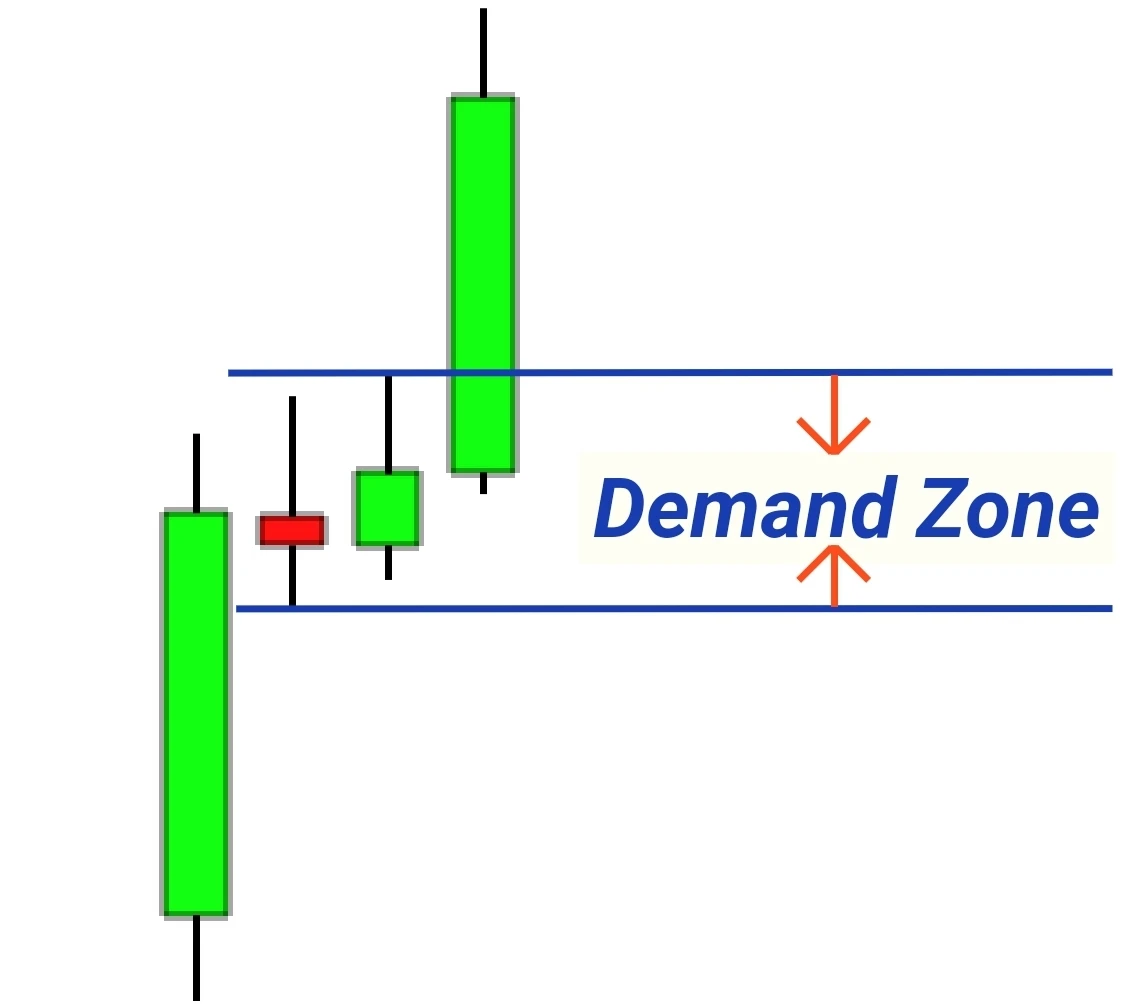
In trading price moves because of buying and selling pressure. A demand zone and supply zone help traders understand where this pressure is likely to appear again. These zones are used in technical analysis to identify areas where the market could reverse or pause.
A demand zone is an area on a chart where buying pressure has been strong enough in the past to push the price up. When the price returns to this zone the traders expect buyers to step in again.
A supply zone is the opposite and it is an area where selling pressure has been strong enough to push the price down before. If the price goes back to this zone then sellers might return.
These zones are not exact price points but they are areas or ranges on a chart. Traders mark them using price history and then watch how the market reacts.
How Demand Zones Form
A demand zone forms when price drops to a level and then moves up strongly. These shows there were enough buyers at that level to absorb selling orders and reverse the move. For example if a stock drops to $50 and then rises to $60 quickly then that area near $50 becomes a demand zone. It shows buyers were willing to buy heavily at that level. Demand zones normally appear after news events, major market dips or during accumulation phases when large traders are building positions.
How Supply Zones Form
Supply zone forms when price rises to a level and then falls sharply. This shows sellers were waiting to sell at that point and which overwhelmed the buying pressure. As an example if a stock climbs to $80 and then falls to $70 then that area near $80 becomes a supply zone. Sellers were active at that price and pushed the market down. Supply zones often occur after strong rallies near resistance levels or during distribution phases when large traders are closing positions.
Why These Zones Matter
Demand and supply zones help traders plan entries and exits. That give an idea of where price can reverse and these zones also help with setting stop-loss levels. If the price breaks through a zone then it means the balance of power has been shifted. Buyers look for entries near demand zones as they expect support and upward movement. Sellers look for entries near supply zones as they expect resistance and downward movement
How to Identify Demand and Supply Zones
- Look at price history
Find areas where price moved sharply up or down after staying in a range for a short time. - Mark the base
For demand zones you should mark the area before the strong move up. For supply zones mark the area before the strong move down. - Include a price range
A zone is not a single line. It can cover a small price range where buying or selling happened. - Check volume
Strong volume at a zone can make it more reliable.
Trading Strategies Using Zones
Buying at Demand Zones: Traders wait for prices to reach to a demand zone before buying as they expect buyers to step in again.
Selling at Supply Zones: Traders sell or short when price reaches a supply zone as they expect sellers to push the prices down again.
Breakout Trading: If price breaks through a demand zone then it gives signal of strong selling pressure and a possible trend reversal. If price breaks through a supply zone then it mean buyers have taken control.
Common Mistakes in Using Zones
Forcing zones where traders mark zones that are too small or without a strong price reaction can lead them to poor trades. Ignoring trend can be risky as trading against the main trend using zones increases risk. Not updating zones is happens when change in market conditions occurs and price has already moved through them multiple times then marked zones lose relevance.
Tips for Using Demand and Supply Zones Effectively
Combine zones with trend analysis for higher accuracy in trading and use higher time frames to spot stronger zones. Wait for confirmation before entering into a trade. This can be change of character of candle pattern. Always use stop loss and market is unpredictable and your analysis may shock you.
The Role of Timeframes
Zones on higher time frames like daily or weekly charts tend to be stronger than those on lower time frames like 5-minute charts. Larger zones represent bigger market participation and may hold more weight. Traders normally look at multiple time frames to confirm their zones.
How Zones Change Over Time
A demand zone can turn into a supply zone if price breaks below it and then retests from the other side and the same works in reverse and this is called a role reversal. Like if price drops through a demand zone and then moves back up to it then sellers may step in at that level which turning it into a supply zone.
Limitations of Demand and Supply Zones
- They are not guaranteed. Price can break through a zone without reversing.
- News events can override historical patterns.
- Market liquidity changes can affect how zones work.
This is why traders use them along with other tools like trend lines, moving averages and market sentiment analysis.
Conclusion
A demand zone and supply zone show where the market has reacted strongly before. These areas can help traders plan their trades, manage risk and understand price behavior. They should not be used alone and combining them with other technical and fundamental tools increases their reliability.
FAQs
1. How do I know if a demand zone is strong?
A strong demand zone usually shows a sharp price move upward from the base with high trading volume. The fewer times price has returned to it and the stronger it tends to be.
2. Can supply and demand zones work in all markets?
Yes, they apply to stocks, forex, commodities and crypto because they are based on price action and human behavior.
3. Do I need indicators to trade using zones?
No, zones are based on price action alone. However some traders use indicators like RSI or MACD for confirmation.
4. Can zones be used in short-term trading?
Yes, but zones on lower time frames are often weaker. They may still work for intraday or scalping strategies but require more active monitoring.


